How do we use infographics to present the data we have?
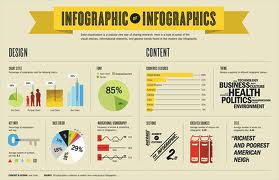
Infographics combine graphics, charts, and text to explain information quickly and clearly. In this lesson, I learned about the difference between graphic design and information design, as well as the elements of an effective infographic. Using tools like Piktochart, I was able to create my own infographic to summarize data and present it visually. Designing an infographic requires creativity and clarity. It made me think critically about how to simplify data while still keeping it informative and attractive. Choosing the right colors, icons, and layout made a big difference in how the information was understood.
Reflection: I enjoyed this lesson because it allowed me to express creativity while learning how to organize data. Infographics helped me realize that good design makes learning faster and easier. It’s a skill that’s very useful in education, marketing, and communication.